
Data Viewer
Analytics & Visualization
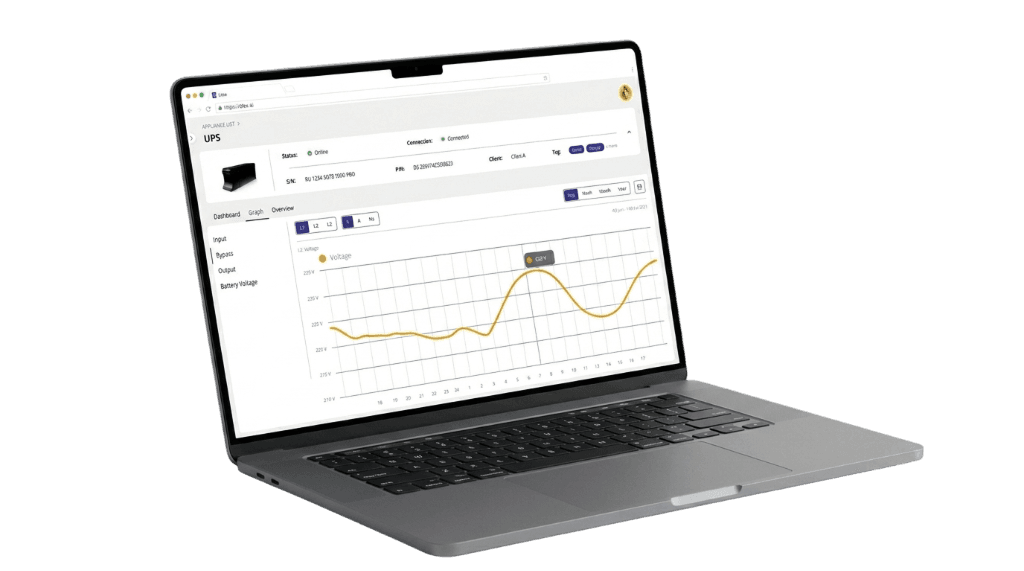
Data Viewer delivers superior user interfaces and analytics. It provides the tools to build sophisticated visualization dashboards, manage multi-tenant access, and integrate application-level logic.
sync_altInteraction
Data Viewer serves as the value-enablement layer, allowing teams to create branded customer web applications and analytics portals while leveraging integrated backend services for secure access.
Feature Availability
Scale your infrastructure with the right feature set for your needs.
| Feature | Starter | Small | Pro | Enterprise | Dedicated |
|---|---|---|---|---|---|
Base DashboardData visualization | check | check | check | check | check |
Custom DashboardsCustom dashboard creation | remove | check | check | check | check |
Multi-UserUser management | remove | check | check | check | check |
RBACAdvanced permissions | close | remove | check | check | check |
BrandingCustomer branding | close | close | remove | check | check |
External IntegrationExternal systems integration | remove | check | check | check | check |
Tenant IsolationCustomer separation | close | close | close | check | check |
Built-in Core Features
Transform your field data into a premium user experience.
Sophisticated Dashboards
Build custom, interactive data visualizations to monitor fleet performance and KPIs in real-time.
Multi-Tenant Access
Securely manage multiple organizations and user roles with granular permission sets built into the core.
App Management
Distribute and manage application lifecycle across your ecosystem, from web apps to edge services.
Why choose Clea for Analytics & Data Visualization
Time-to-Value
Rapidly deploy professional-grade analytics interfaces without building complex frontend infrastructure from scratch.
White-label Ready
Fully customizable branding and styling to ensure the experience aligns perfectly with your corporate identity.
Enterprise Ready
Designed for complex organizational structures with advanced user management and audit logging features.
Master the Value Lifecycle
Data Viewer helps you extract and deliver maximum value from your connected hardware ecosystem.
Data Ingestion
Accessing structured streams from Data Orchestrator and device info from Device Manager.
Visualization
Turning telemetry into clear, actionable charts and real-time status indicators.
User Onboarding
Defining roles and inviting customers to their dedicated organization view.
Operational Control
Providing the tools for end-users to interact with and manage their own device fleets.
Ready to wow your customers?
Start building your custom analytics portal with Clea today.